Welcome to Strategic Business Analytics with R, a comprehensive tutorial designed for students who are new to R and want to develop proficiency in using RStudwio, Tidyverse, and Tidymodels for empirical data analysis in business contexts. This is the website for the 2nd edition of “Strategic Business Analytics with R”. This book will teach you how to do data data analytics for managerial decision-making with R.
About This Book
This course book aims to bridge the gap between basic R programming and applying structured code for business analytics. We progress from foundational programming skills to advanced machine learning applications, with a focus on practical, hands-on learning using real-world business data.
Course Objectives
By the end of this course, you will be able to:
Set up and efficiently use RStudio for business analytics projects
Master data manipulation and transformation using the Tidyverse ecosystem
Create insightful data visualizations to communicate business insights
Implement and interpret regression models for business applications
Apply classification techniques to solve business problems
Tune and optimize machine learning models for improved performance
Deploy interpretable AI solutions in business contexts
Utilize advanced analytics techniques such as time series forecasting, text mining, and geospatial analysis
Target Audience
This course is designed for:
Master’s students in strategy, accounting, economics, finance, or related fields
Professionals seeking to enhance their data analysis skills
Individuals with little to no prior experience with R
Anyone interested in applying data science techniques to business problems
How to Use This Book
This book is structured to follow the progression of the strategic business analytics course at WU Vienna University of Economics and Business, with each chapter corresponding to a session. Each chapter includes:
Clear learning objectives
Prerequisites and required R packages
Step-by-step explanations with code snippets
Real-world business case studies
Interpretation of R output with business implications
Exercises and challenges to reinforce learning
You can navigate through the chapters using the sidebar on the left. The book is designed to be read sequentially, but you can also jump to specific topics of interest.
Code Examples
All code examples in this book are executable. You can copy and paste the code into your own R environment to follow along. The code is also available in the accompanying GitHub repository.
# This is an example of R codelibrary(tidyverse)
Warning: package 'lubridate' was built under R version 4.4.1
── Attaching core tidyverse packages ──────────────────────── tidyverse 2.0.0 ──
✔ dplyr     1.1.4     ✔ readr     2.1.5
✔ forcats   1.0.0     ✔ stringr   1.5.1
✔ ggplot2   3.5.1     ✔ tibble    3.2.1
✔ lubridate 1.9.4     ✔ tidyr     1.3.1
✔ purrr     1.0.2
── Conflicts ────────────────────────────────────────── tidyverse_conflicts() ──
✖ dplyr::filter() masks stats::filter()
✖ dplyr::lag()    masks stats::lag()
ℹ Use the conflicted package (<http://conflicted.r-lib.org/>) to force all conflicts to become errors
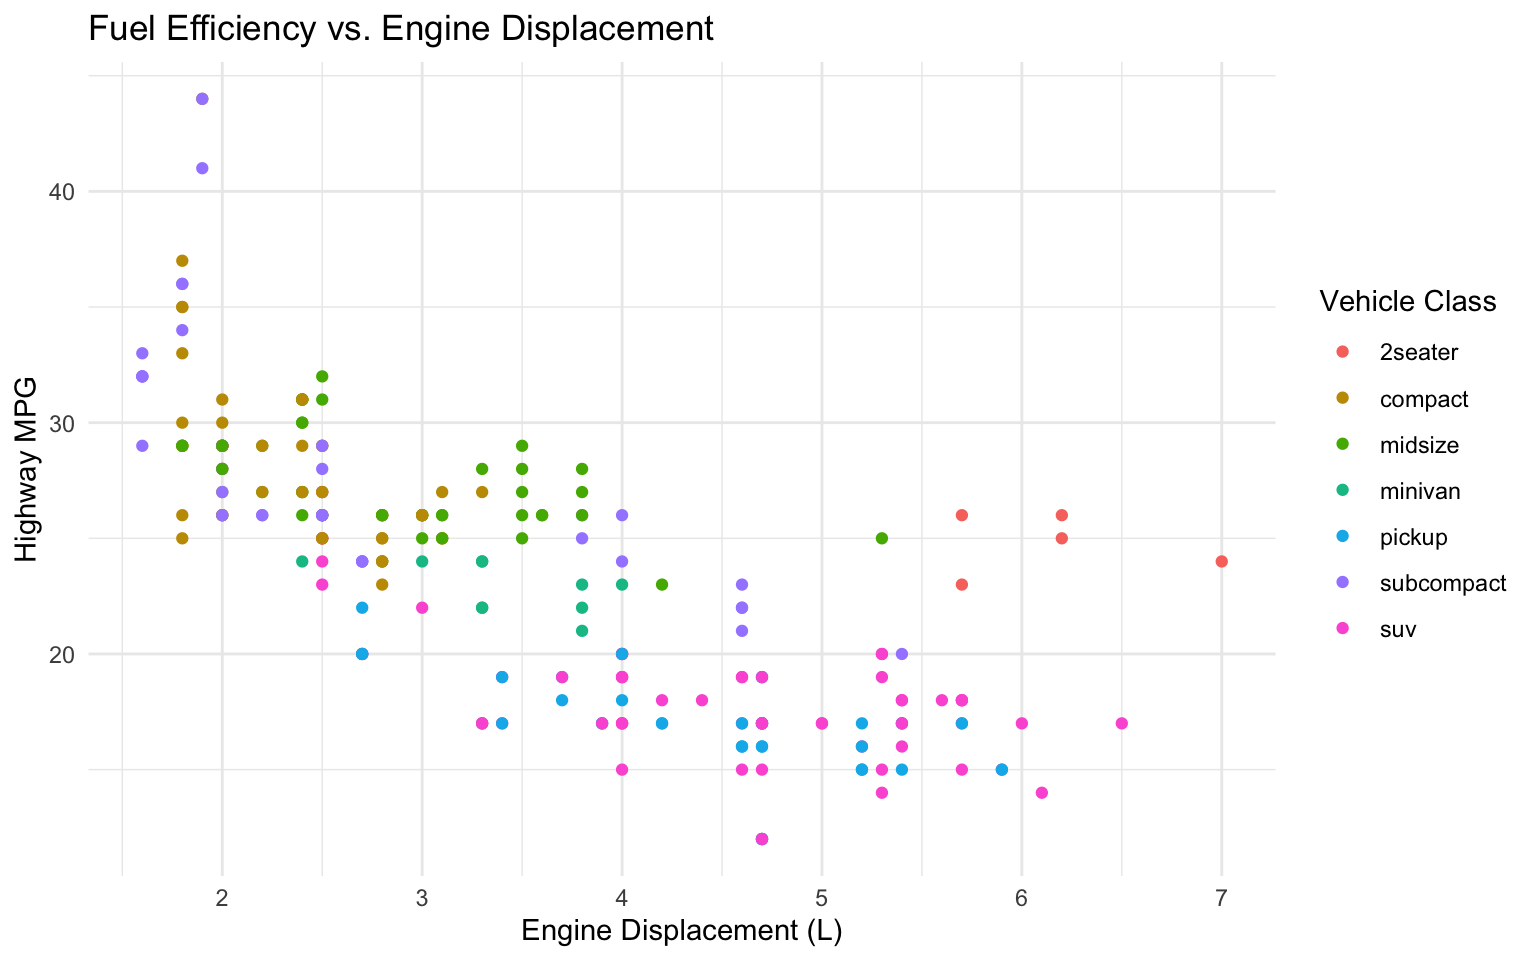
ggplot(mpg, aes(x = displ, y = hwy, color = class)) +geom_point() +labs(title ="Fuel Efficiency vs. Engine Displacement",x ="Engine Displacement (L)",y ="Highway MPG",color ="Vehicle Class" ) +theme_minimal()
Exercises
Each chapter includes exercises to help you practice and reinforce the concepts covered. We encourage you to attempt these exercises before looking at the solutions.
Course Structure
The course is structured into seven chapters, each covering a specific aspect of business analytics with R:
Computational Foundations for Strategic Business Analytics: Introduction to R, RStudio, and the Tidyverse ecosystem, with a focus on data manipulation and transformation.
Statistical Computing & Data Visualization: Techniques for exploratory data analysis and creating effective visualizations using ggplot2 and modelsummary.
Predictive Modeling I: Regression Analysis & Model Diagnostics: Implementation and interpretation of regression models for business applications, with a focus on the feols package.
Predictive Modeling II: Probabilistic & Tree-Based Classification: Application of logistic regression and tree-based classification algorithms for business problems.
Machine Learning (ML) I: Model Selection & Hyperparameter Tuning: Techniques for selecting and optimizing machine learning models using tidymodels.
Machine Learning (ML) II: Deployment & Interpretable AI: Deployment of machine learning models and interpretation of results using the shapviz package.
Additional Topics: Exploration of advanced techniques such as time series forecasting, text mining, geospatial analysis, network analysis, and ensemble methods.
Acknowledgments
I would like to thank all the contributors who made this course possible, including the developers of the R packages used throughout the book, the reviewers who provided valuable feedback, and the students who tested the material.
Special thanks to the R community for creating and maintaining the open-source tools that make this type of analysis accessible to everyone.
Setting up a dedicated project folder for this course
Installing the required R packages (instructions provided in each chapter)
Following along with the code examples and completing the exercises
Let’s go to work.
Source Code
# Preface {.unnumbered}Welcome to **Strategic Business Analytics with R**, a comprehensive tutorial designed for students who are new to R and want to develop proficiency in using RStudwio, Tidyverse, and Tidymodels for empirical data analysis in business contexts. This is the website for the 2nd edition of “Strategic Business Analytics with R”. This book will teach you how to do data data analytics for managerial decision-making with R.## About This Book {.unnumbered}This course book aims to bridge the gap between basic R programming and applying structured code for business analytics. We progress from foundational programming skills to advanced machine learning applications, with a focus on practical, hands-on learning using real-world business data.### Course Objectives {.unnumbered}By the end of this course, you will be able to:- Set up and efficiently use RStudio for business analytics projects- Master data manipulation and transformation using the Tidyverse ecosystem- Create insightful data visualizations to communicate business insights- Implement and interpret regression models for business applications- Apply classification techniques to solve business problems- Tune and optimize machine learning models for improved performance- Deploy interpretable AI solutions in business contexts- Utilize advanced analytics techniques such as time series forecasting, text mining, and geospatial analysis### Target Audience {.unnumbered}This course is designed for:- Master's students in strategy, accounting, economics, finance, or related fields- Professionals seeking to enhance their data analysis skills- Individuals with little to no prior experience with R- Anyone interested in applying data science techniques to business problems## How to Use This Book {.unnumbered}This book is structured to follow the progression of the strategic business analytics course at WU Vienna University of Economics and Business, with each chapter corresponding to a session. Each chapter includes:- Clear learning objectives- Prerequisites and required R packages- Step-by-step explanations with code snippets- Real-world business case studies- Interpretation of R output with business implications- Exercises and challenges to reinforce learningYou can navigate through the chapters using the sidebar on the left. The book is designed to be read sequentially, but you can also jump to specific topics of interest.### Code Examples {.unnumbered}All code examples in this book are executable. You can copy and paste the code into your own R environment to follow along. The code is also available in the accompanying GitHub repository.```{r}#| label: example#| eval: true# This is an example of R codelibrary(tidyverse)ggplot(mpg, aes(x = displ, y = hwy, color = class)) +geom_point() +labs(title ="Fuel Efficiency vs. Engine Displacement",x ="Engine Displacement (L)",y ="Highway MPG",color ="Vehicle Class" ) +theme_minimal()```### Exercises {.unnumbered}Each chapter includes exercises to help you practice and reinforce the concepts covered. We encourage you to attempt these exercises before looking at the solutions.## Course Structure {.unnumbered}The course is structured into seven chapters, each covering a specific aspect of business analytics with R:1. **Computational Foundations for Strategic Business Analytics**: Introduction to R, RStudio, and the Tidyverse ecosystem, with a focus on data manipulation and transformation.2. **Statistical Computing & Data Visualization**: Techniques for exploratory data analysis and creating effective visualizations using ggplot2 and modelsummary.3. **Predictive Modeling I: Regression Analysis & Model Diagnostics**: Implementation and interpretation of regression models for business applications, with a focus on the feols package.4. **Predictive Modeling II: Probabilistic & Tree-Based Classification**: Application of logistic regression and tree-based classification algorithms for business problems.5. **Machine Learning (ML) I: Model Selection & Hyperparameter Tuning**: Techniques for selecting and optimizing machine learning models using tidymodels.6. **Machine Learning (ML) II: Deployment & Interpretable AI**: Deployment of machine learning models and interpretation of results using the shapviz package.7. **Additional Topics**: Exploration of advanced techniques such as time series forecasting, text mining, geospatial analysis, network analysis, and ensemble methods.## Acknowledgments {.unnumbered}I would like to thank all the contributors who made this course possible, including the developers of the R packages used throughout the book, the reviewers who provided valuable feedback, and the students who tested the material.Special thanks to the R community for creating and maintaining the open-source tools that make this type of analysis accessible to everyone.## Getting Started {.unnumbered}To get the most out of this course, we recommend:1. Installing the latest versions of [R](https://cran.r-project.org/) and [RStudio](https://posit.co/download/rstudio-desktop/)2. Setting up a dedicated project folder for this course3. Installing the required R packages (instructions provided in each chapter)4. Following along with the code examples and completing the exercisesLet's go to work.